Grafana Dashboards
Table of Contents
Introduction
Grafana is an open source dashboard application used to present data from a variety of sources. For this project, it is used to display data from the power monitor database and show it to you in a meaningful way.
The application is installed by default in the prebuilt OS image, and you can check its operational status with systemctl:
Check Grafana’s Operational Status
sudo systemctl status grafana-server.service
Restart Grafana
sudo systemctl restart grafana-server.service
Grafana may need to be restarted if you try to access it on the very first startup of your newly flashed power monitor image. If your dashboard shows a bunch of red warning symbols, try to restart Grafana with the command shown above. This occasionally happens only on the initial boot.
Accessing Grafana
You can access Grafana from a cell phone, computer, or tablet on the same network as your Raspberry Pi. You’ll need to know the IP address assigned to your Raspberry Pi, which you can find in the terminal with the following command:
ip addr | grep -P "^\d.+|inet"
If you connected your Pi to Wi-Fi, the IP will be listed under the wlan0 entry. If you connected it via an Ethernet cable, the IP will be listed under the eth0 entry.
Sample Output: (click to expand)
pi@rpipowermonitor:~ $ ip addr | grep -P "^\d.+|inet"
1: lo: <LOOPBACK,UP,LOWER_UP> mtu 65536 qdisc noqueue state UNKNOWN group default qlen 1000
    inet 127.0.0.1/8 scope host lo
    inet6 ::1/128 scope host
2: eth0: <BROADCAST,MULTICAST,UP,LOWER_UP> mtu 1500 qdisc mq state UP group default qlen 1000
    inet 192.168.10.219/24 brd 192.168.10.255 scope global dynamic noprefixroute eth0
    inet6 fe80::f236:6464:ac3f:337e/64 scope link
3: wlan0: <NO-CARRIER,BROADCAST,MULTICAST,UP> mtu 1500 qdisc pfifo_fast state DOWN group default qlen 1000
Based on the sample output above, this Pi has an IP address of 192.168.10.219.
Now that you’ve found your Raspberry Pi’s IP address, you can get to Grafana from a web browser on another device in your network. Simply navigate to http://your-pis-ip-addr:3000.
Default Login Credentials
Grafana’s default login credentials are admin and admin. When logging in for the first time, you’ll be prompted to change the admin password.
Viewing Dashboards
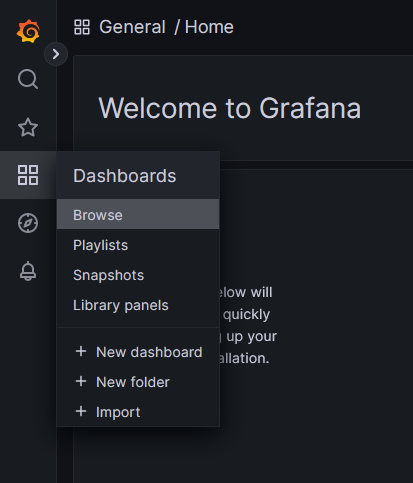
In the prebuilt OS image, Grafana is already configured for you. To access the dashboards, navigate to the Dashboards option, and then select browse, as shown below:
Then, open up the General folder, and you’ll see the following dashboards:
-
Home Power Dashboard
This dashboard primarily shows detailed daily data but also includes a daily summary for the previous 60 days.
Preview | Download JSON -
Individual CT Data
This dashboard shows detailed power (Watts), measured energy (kilowatt-hours), amperage (amperes), and power factor data from each individual CT.
Preview | Download JSON
Building Dashboards
Creating your own dashboards is well documented in Grafana’s documentation. YouTube is also a great resource for learning how to work with Grafana’s dashboard editor. When creating your own dashboard, you’ll need to know what measurements and fields are available for use, which you can read about in the Database Info section.
When logged into Grafana as admin and viewing a dashboard, you can edit any of the existing panels/graphs from the included dashboards to see exactly how they’re created.